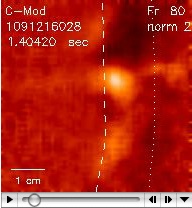
C-Mod Edge Turbulence Data at L-H Tansitions
from GPI camera at 400,000 frames/sec

taken in collaboration with Jim Terry of MIT

photo of turbulence photo of turbulence These are images of a 6x6 cm region just above the outer midplane of C-Mod. The dashed line is the separatrix and the dotted line is the limiter shadow. These videos were taken at 400,000 frames/sec using a Phantom 710 camera. At the left is a frame of raw 'unormalized data', and at the right is a frame of 'normalized data' made by normalizing all frames to the average frame.


All frame data normalized to time-average frame

Shot 1110114032 L-H transition at 0.923 sec
Shot 1120223031 dithering to L-H transition at 0.826 sec
Shot 1120223031 dithering to L-H transition at 0.886 sec
Shot 1120224019 3 kHz dithering
Shot 1120224022 slow dithering 1.038 sec
Shot 1120224022 slow dithering at 1.092 sec
Shot 1120224024 L-H transition at 1.105 sec
Shot 1120224025 L-H transition at 1.098 sec
Shot 1120224029 L-H transition at 1.089 sec
Shot 1120224030 L-H transition at 1.091 sec